| |
Introduction to Wviz
Description: This tutorial shows how to launch wviz and visualize basic sensor messages and display types in a web browser.Keywords: wviz, web, visualization
Tutorial Level: BEGINNER
Contents
Scope
This tutorial is intended for beginners in wviz. Here we explain how to launch necessary nodes to visualize the PR2 and its sensor data using a web browser.
What You Will Need
Other than the bosch_web_visualization stack, to replicate this tutorial you will need to download and install the mjpeg_server unary stack:
$ cd /somewhere/in/your/ros/path
$ svn checkout
$ rosmake mjpeg_server
You will also need the pr2_simulator stack. In fuerte you can install it with the following command:
$ sudo apt-get install ros-fuerte-pr2-simulator
Launch
Let's launch the simulator first
$ roslaunch pr2_gazebo pr2_empty_world.launch
Now let's launch all necessary nodes to visualize the simulator over the web. The following command will launch mjpeg_server (so that you have access to cameras), tf_lister (for choosing a tf using dropdown lists), wviz_tf_manager (for throttling the tfs), rosbridge_server (for communicating with ros master), rosapi (for getting message types, parameters etc.) and roswww (for serving the web page). If you would like to know more about a specific node, please refer to its main page.
$ roslaunch wviz wviz.launch
During launch roswww will tell you which port it has successfully opened. If it is not already busy, it will most likely be port 8000. The message in your terminal should look like this
Webserver successfully started on port 8000
Now you can open a tab in your Chrome, and go to
http://localhost:8000/wviz/
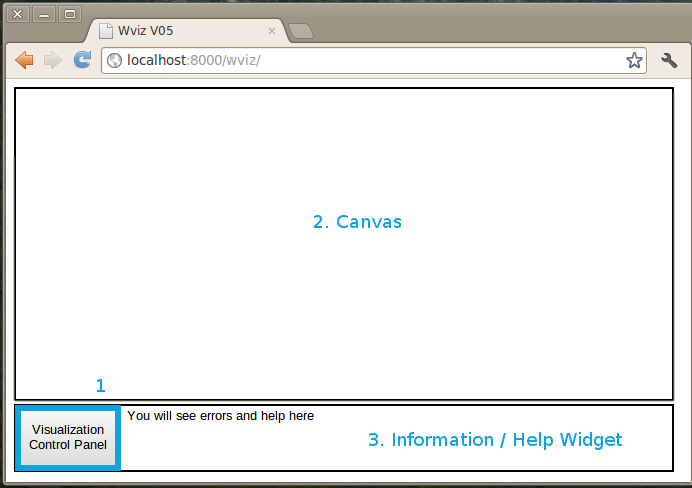
If everything is OK you should see a page with a small Visualization Control Panel button at the lower left corner.
Interface

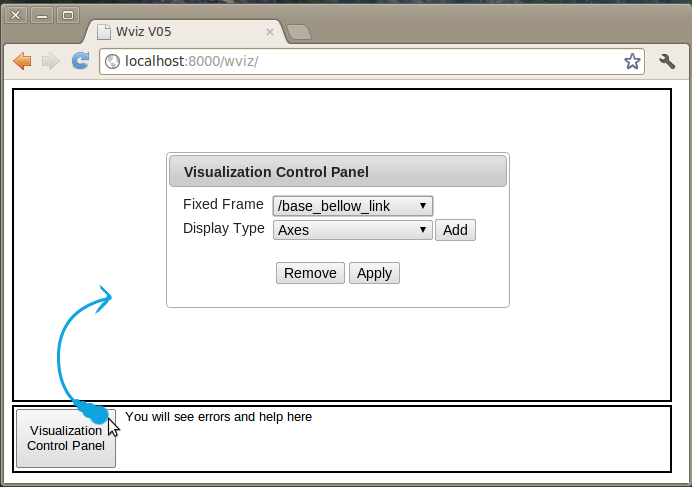
- The interface is intended to be plain and straightforward to use. Visualization Control Panel (which is the only button) is where you should go for managing your displays.
- The big portion of the page is occupied by the canvas. That is where you see 3D objects being rendered. Left-click and mouse drag rotates the scene, whereas middle-click and dragging translates the scene. You can also zoom in and out using the wheel. You can right-click on interactive markers in the scene to open the context menu.
- You will also notice that the bottom part of the page is separated for error and help messages. This widget is not actively used in the current version but is there as a place holder for future use.
Adding New Display Types
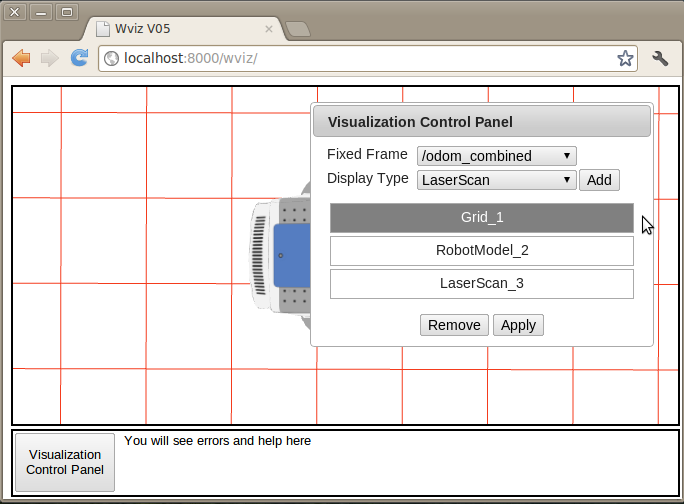
To add a new display, first select a type from the drop-down menu and then click on the Add button right next to it. When you add a new display, you will see its name being added in the list of displays.

Rendered Displays
Almost all display types in wviz are rendered in the canvas.
Floating Displays
Currently camera is the only floating display type in wviz. After adding a new camera you can move it around if it occludes the canvas.
Opening Display Properties
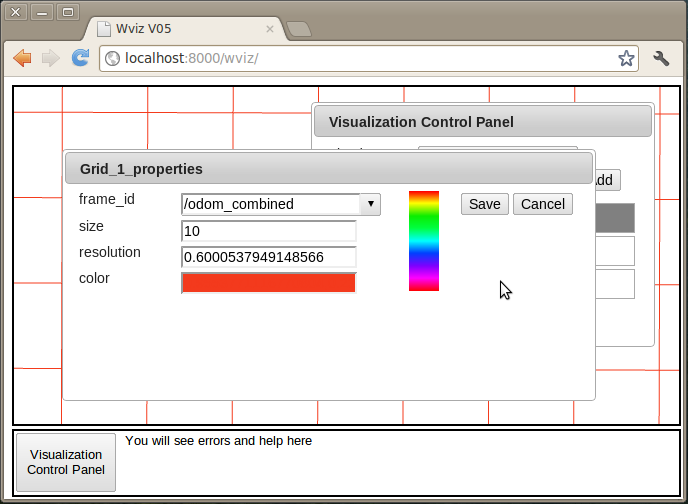
To change the properties of a display, double-click on its name in the list of available displays.

You can make your changes in the properties dialog.

Removing Display Types
To remove a display, first select a the display from the list of available displays, and then click on the Remove button right next to it.
Saving Changes
After adding / modifying / removing your different display types, clicking on Apply, will close the Visualization Control Panel and refresh the displays you have added.
See Wviz in Action
The following video shows how to launch wviz and visualize basic sensor messages and display types in a web browser.


